
Human hearing is a weird and wonderful thing. The branch of psychophysics concerned with sound perception is psychoacoustics, and it explains a lot about why we hear the way we do. As mix engineers we need to become familiar with how the ear interprets sound, because perception is often different than what’s actually coming from the speakers. One concept to look at is equal-loudness, first laid out in the Fletcher-Munson curves.
What are Fletcher-Munson curves?
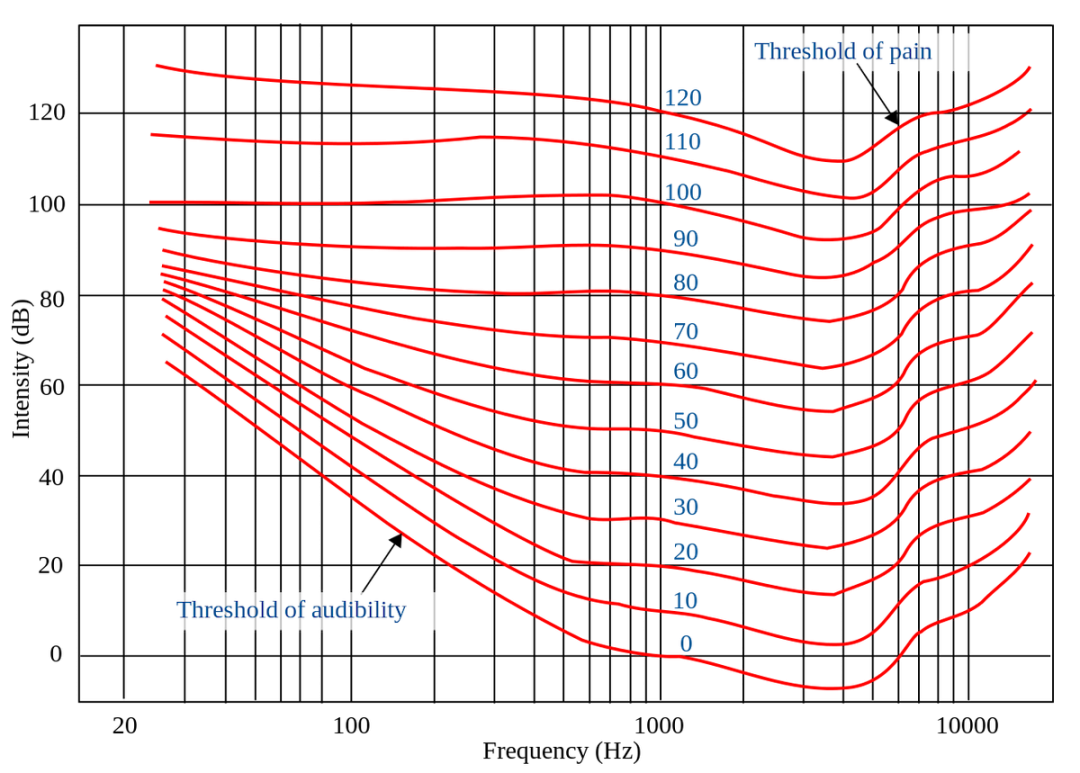
Harvey Fletcher and Wilden Munson were American physicists who, in the 1930s, were the first to research an important psychoacoustic phenomenon. Through their work, they determined that we perceive certain frequencies as louder or quieter when the actual loudness of the sound goes up or down. The Fletcher-Munson curves are a series of plots on an X/Y graph, where X is frequency and Y is loudness in dB SPL.
- At lower volumes, midrange frequencies appear to be the loudest or most noticeable, while lows and highs take a backseat.
- At higher volumes, the lows and highs become more noticeable, while our ears become less sensitive to the midrange.
Today, most researchers prefer to use “equal-loudness contours” as a catchall term for the preliminary research done by Fletcher and Munson. Their work has been revised over the years, so the Fletcher-Munson curves are now a subset of equal-loudness contours.
Fletcher-Munson Curves vs. ISO 226
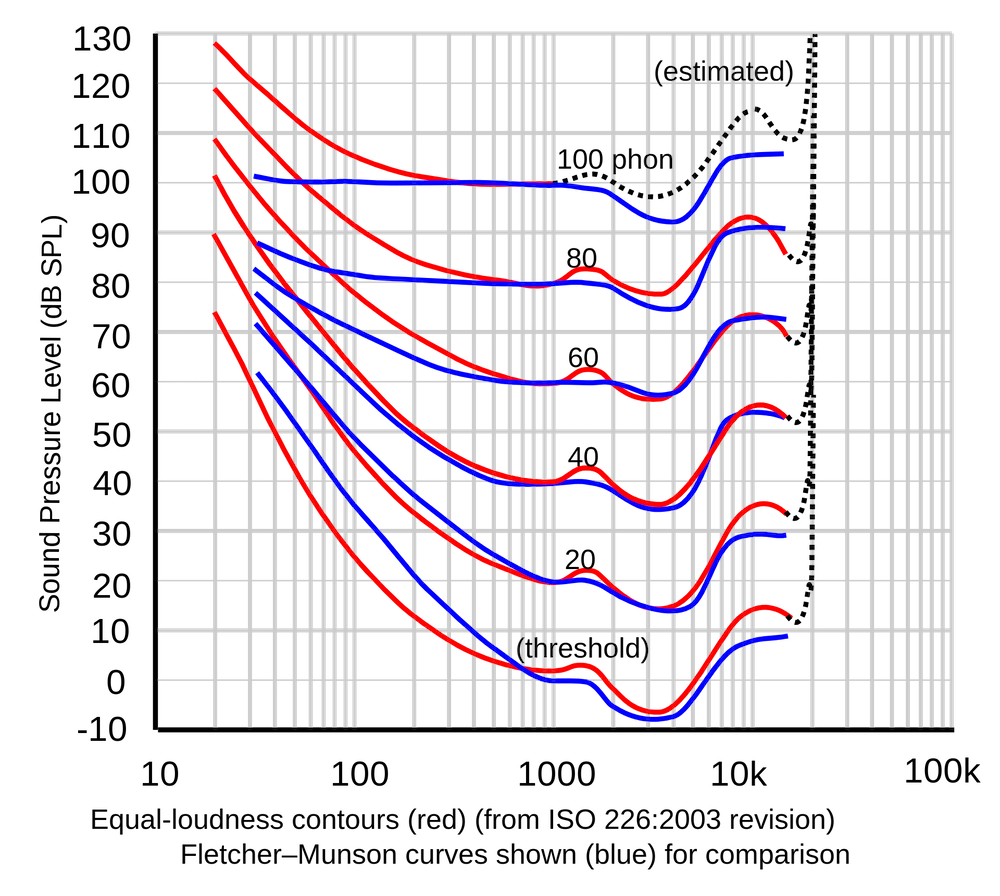

In 1956, D.W. Robinson and R.S. conducted their own research and created the Robinson-Dadson curves. These findings were a definitive basis for equal-loudness curves and became the ISO 226 standard.
In 2003, the International Organization for Standardization (ISO) revised ISO 226. Researchers began noting discrepancies between the Robinson-Dadson curves and more recent findings. The new standard, known as ISO 226:2003, shows that the Fletcher-Munson curves from 1933 were very accurate—the Robinson-Dadson curves were an outlier compared to Fletcher-Munson and modern studies.
Application of Equal-Loudness Contours
All of this information is interesting, sure. But how does it apply to audio engineering? How can we use the science of sound to our advantage?
Using the Fletcher-Munson curves while mixing
As we piece this knowledge about equal-loudness together with what we know about a good mix, problems become pretty obvious. One of the hallmarks of a great mix is a balanced frequency range. How are we supposed to create balance when frequencies will sound totally different depending on how loud the listener plays the song?
Maybe you’ve already experienced this phenomenon yourself. You mix relatively quietly one day, only to the find the lows and highs lacking the next day. You compensate, and on the third day, you turn the volume up. Suddenly the lows are overwhelming and the high-end is harsh. This is a never-ending cycle!
Engineering wisdom, alongside the Fletcher-Munson curves, tells us that somewhere between 80 and 85 dB SPL is the ideal mixing level. It’s not quiet, but not painfully loud either. It’s the sweet spot for hearing the frequency spectrum as balanced as possible.
If you do most of your mixing around 80 dB, and reference at louder and quieter volumes, you should be alright. Just be sure to take frequent breaks, as 80 dB is a fatiguing level.
Another rule of thumb is to imagine the listener. When people are enjoying music and really paying attention to it, chances are they’re going to be listening (comfortably) loud. If you mixed at a quiet level the whole time, and boosted the heck out of the lows and highs to compensate, the mix is going to sound bad cranked. Try to mix somewhere in the middle and the results should translate, regardless of volume. It will sound different at different volumes, but the idea is that it still sounds pleasing no matter what.
Keep the intended audience in mind, as well as what you know about perceived frequencies at different levels, to help guide mixing decisions. Ultimately, the goal is to make the mix sound good at any volume.
Using the Fletcher-Munson curves while mastering
Mastering engineers can apply what they know about Fletcher-Munson curves in similar ways as mixing engineers. When fine-tuning the overall frequency balance of a mix, mastering engineers will want to take note of the volume they’re monitoring at and how the sound is perceived.
Mastering engineers know how to push frequencies and levels in ways that excite listeners for the funnest and most pleasing listening experience possible. Much of that comes down to what we know about the Fletcher-Munson curves and equal-loudness contours.